In terms of financial trading, the term ‘evening star’ is referred to as a stock-price pattern used in reversal pattern trends. An evening candlestick pattern consists of three candles. These include one large white candlestick, a small-bodied candle and a red candle. Typically, these patterns are linked to a rise in price uptrend, which indicates the uptrend is coming to an end.
The morning star pattern is the complete opposite of the evening star candlestick pattern patterns in conjunction with one another to study and make trading plans. So, let us understand the steps involved in the pattern and its working.
Steps of Trading the Candlestick Pattern
There are a total of seven steps involved in the trading candlestick pattern. These include setting the correct chart time frame, evaluating open, high and close prices, RSI levels, downgrading of the time frame, short selling, establishing a short loss, and taking profits. These are included below.
1. Setting of the Correct Chart Time Frame
Time frame is an essential factor that influences the trading strategy. Investors can change the timings to suit their requirements. However, these must be tested through paper-trading for testing the assumptions.
2. Evaluation of the Open, High, Low and Close Prices
The candle charts which are prepared daily are a reflection of such prices. It shows the open and close prices and the high and low prices. The candle body shows the former, whereas the shadows and wicks show the latter.
3. Checking RSI Prices
The RSI levels must be checked frequently. Usually, traders believe that if the daily RSI crosses above 70, it is a direct indication of the overbought signal.
4. Downgrading the Time Frame
On identification of overbought conditions, the RSI mark crosses 70. The most common time frame used for such patterns is a five-minute candlestick chart. It is because these are neither too fast nor too slow for trading.
5. Short Selling
Short selling refers to when you borrow and sell the shares of stock. In such a process, the trader borrows at a high price and expects a significant price drop. On this assumption, the shares are bought at lower prices to pay back to the broker. This approach is used by investors when there’s a down-trending market. However, the shorting strategy is not recommended for new investors in the market.
6. Establish a Stop Loss
A stop loss is referred to as the predetermined exit price when the trader goes wrong. This can be established with the process of slippage. It refers to a situation when the prices move too fast, then the percentage of investors can decrease and can get passed by.
7. Setting of Target
It is essential to set a target before forecasting the profits or losses on the trade. Therefore, the investor must carefully evaluate and set achievable targets.
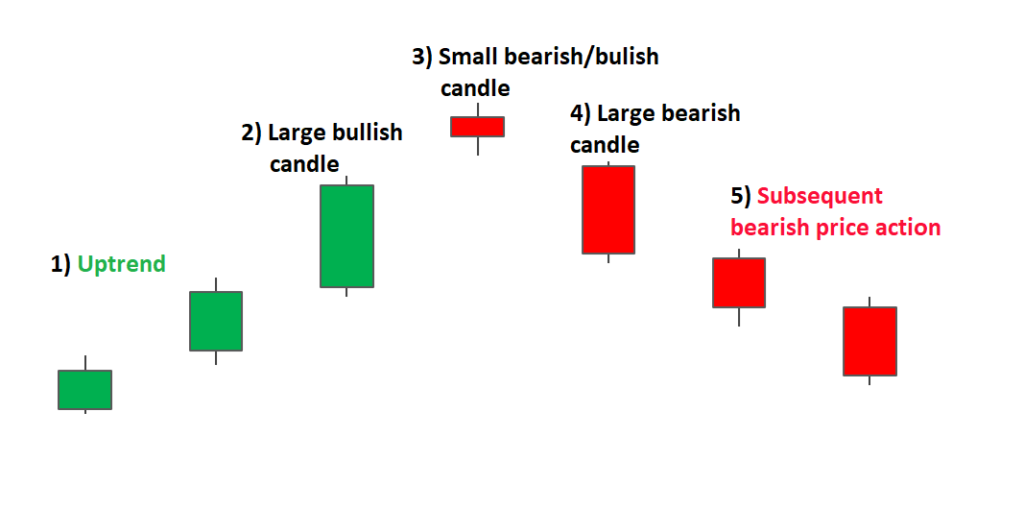
Working of Evening Star Pattern
The pattern of the evening star is known to indicate the declines in future prices. This pattern takes its form in three days:
- Increase in Prices
The first day deals with an increase in the prices; this is similar to a large white candle.
- Modest Rise in Prices
The second day deals with a modest rise in price, which is shown by a smaller candle.
- Opening Prices
A huge red candle depicts the third day; the opening price of this day is lower than the previous day. During the middle of the first day, the third day closes.
Conclusion
What commodities in share market? All these commodities’ stock prices are interrelated and interdependent on one another. Therefore, the trader must carefully weigh the benefits and opt for maximum returns on investments.


Leave a Comment
You must be logged in to post a comment.